As you’re preparing your marketing budget for the next year, you’ll need to understand the effectiveness of your marketing efforts at each stage of the sales funnel—at the Awareness, Consideration, and Decision stages. Knowing where you’re succeeding and what areas need the most attention in the next year will help guide your budgeting decisions.
We’ve already walked you through tracking your Awareness metrics. Next you’ll need to track your effectiveness at the Consideration stage. That means you’re tracking metrics that show you how well you’re converting visitors into leads.

You could also track your nurturing in the Decision stage, but we’ll cover that in another article.
Which KPIs are the right ones to track conversions? We’ll walk you through it.
Visits by Source
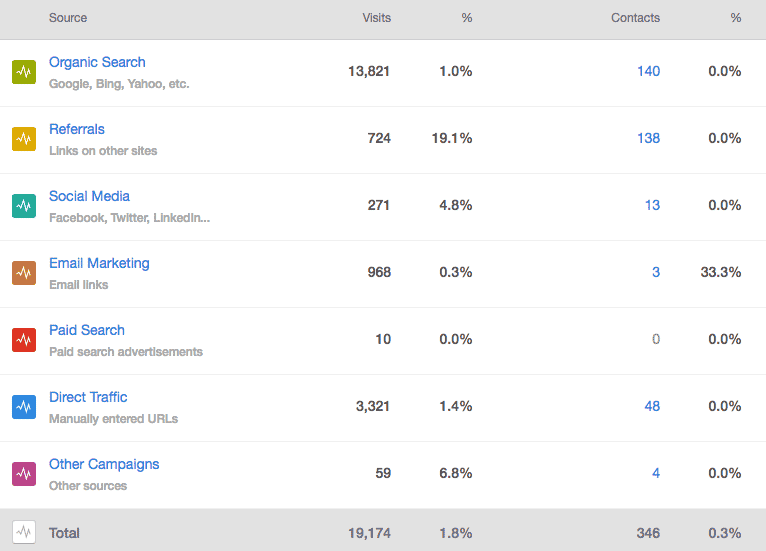
Run a Sources report in HubSpot (or analyze the channels in Google Analytics) and look at the number of visits you get each month from each source—organic traffic, search engines, referrals, social media, etc. Dive down on social media and identify which social media channels are performing best and worst for driving traffic.
Identifying top and worst performers will help you determine which sources you need to invest into. More traffic from those sources will help drive more conversions.

Notice a spike? If you’re adding marketing actions to your campaigns, you’ll be able to attribute those spikes in user activity to specific inbound marketing events that occurred.
Conversions by Source
The HubSpot Sources report shows you how many new contacts you generated in a specified time frame. These are your conversions for the month. The % sign next to the Visits shows your conversion rate from that source. Aim for 30% for source that brings 1000 visits or more.
In addition to knowing which source brought in the traffic, you can do a more detailed breakdown of the who, what, and where—such as which keywords, which social profile, which post, and which referring websites are helping drive the most conversions.
This information shows you how well your sources are leading to conversions. Notice anything that stands out in your top- and bottom-performing sources. You’ll need to investigate what makes them stand out, and how you can improve the cellar dwellers.

Visits to Your Website Vs. Visits to Landing Pages
You could be getting a lot of traffic at the Consideration stage, but if visitors aren’t going to your landing pages, you’ve got some work to do. Check the breakdown of visitors to your site vs. visitors to your landing pages. In the Sources report, filter by your landing page domain to see how many of your site visitors are hitting your landing pages. If it’s lower than you’re aiming for, you’ll need to invest into improving that number in the next year.

CTA Performance
One of the most important metrics to track at the Consideration stage is the effectiveness of your calls to action. If your visitors see your CTAs but don’t click on them, you won’t get them to convert on your landing pages. You can track CTA metrics in the HubSpot Calls to Action tool.
For the Consideration stage, focus on tracking these two CTA metrics:
- CTA views to clicks. This is the click-through rate of the CTAs that your visitors encounter. In other words, what percentage of visitors did the CTA drive to a landing page?
- CTA clicks to submission. This is the number of form submissions that occur after the CTA is clicked. It shows how effective the CTA is in influencing form submissions on a landing page. Use this to compare different CTAs that lead to the same landing page.

Landing Page Performance
Just because someone gets to a landing page, that doesn’t mean they’ll actually fill out a form and convert to a lead. It’s important to know how well your landing pages are performing, once your visitors arrive there.
You’ll need to identify the top- and bottom-performing landing pages and make improvements to your lowest-converting pages, based on what you see in the most effective ones.
Go to the Landing Page Performance report in HubSpot and analyze the Views, Submissions, and New Contacts metrics for the past month. Notice the ratio of new contacts to submissions—this will tell you how many of your conversions are in the nurturing phase of the Consideration stage. As a rule of thumb, for every 1000 visits you should have at least a 30% conversion rate.

Path Performance to Conversions
Most of your visitors will come to a landing page from some other page on your site. And many of them will visit your site multiple times before getting to a landing page. It can be very revealing to track the pathways your visitors take before arriving at your landing pages. The Attribution report shows you the journey someone takes from the first time they enter your website until they convert. This tells you what made your visitors convert.
Use this information to spot the marketing effort that led to a conversion and make smart decisions about where to invest your time and resources.
Tracking the right metrics at the Consideration stage will give you a good handle on the areas where you’re getting the most ROI and where you need to focus your efforts next year. Use that information to identify your needs for next year—and build your budget around that. Having concrete numbers and goals will set you up for a successful marketing budget.
Get the latest news
Blog Topics
- Analytics
- Branding & Identity
- Budget
- Construction
- Content Marketing
- Conversion Rate Optimization
- Email Marketing
- HubSpot
- Inbound Marketing
- Lead Generation
- Marketing Strategy
- News/Events
- Paid Search & PPC
- Recruiting
- Sales & Marketing
- Sales Enablement
- Search Engine Marketing
- Search Engine Optimization
- Social Media
- Thought Leadership
- Uncategorized
- Usability
- Video Marketing
- Web Hosting
- Website Design